Kapitelklicken springt direkt hin
Shownotes
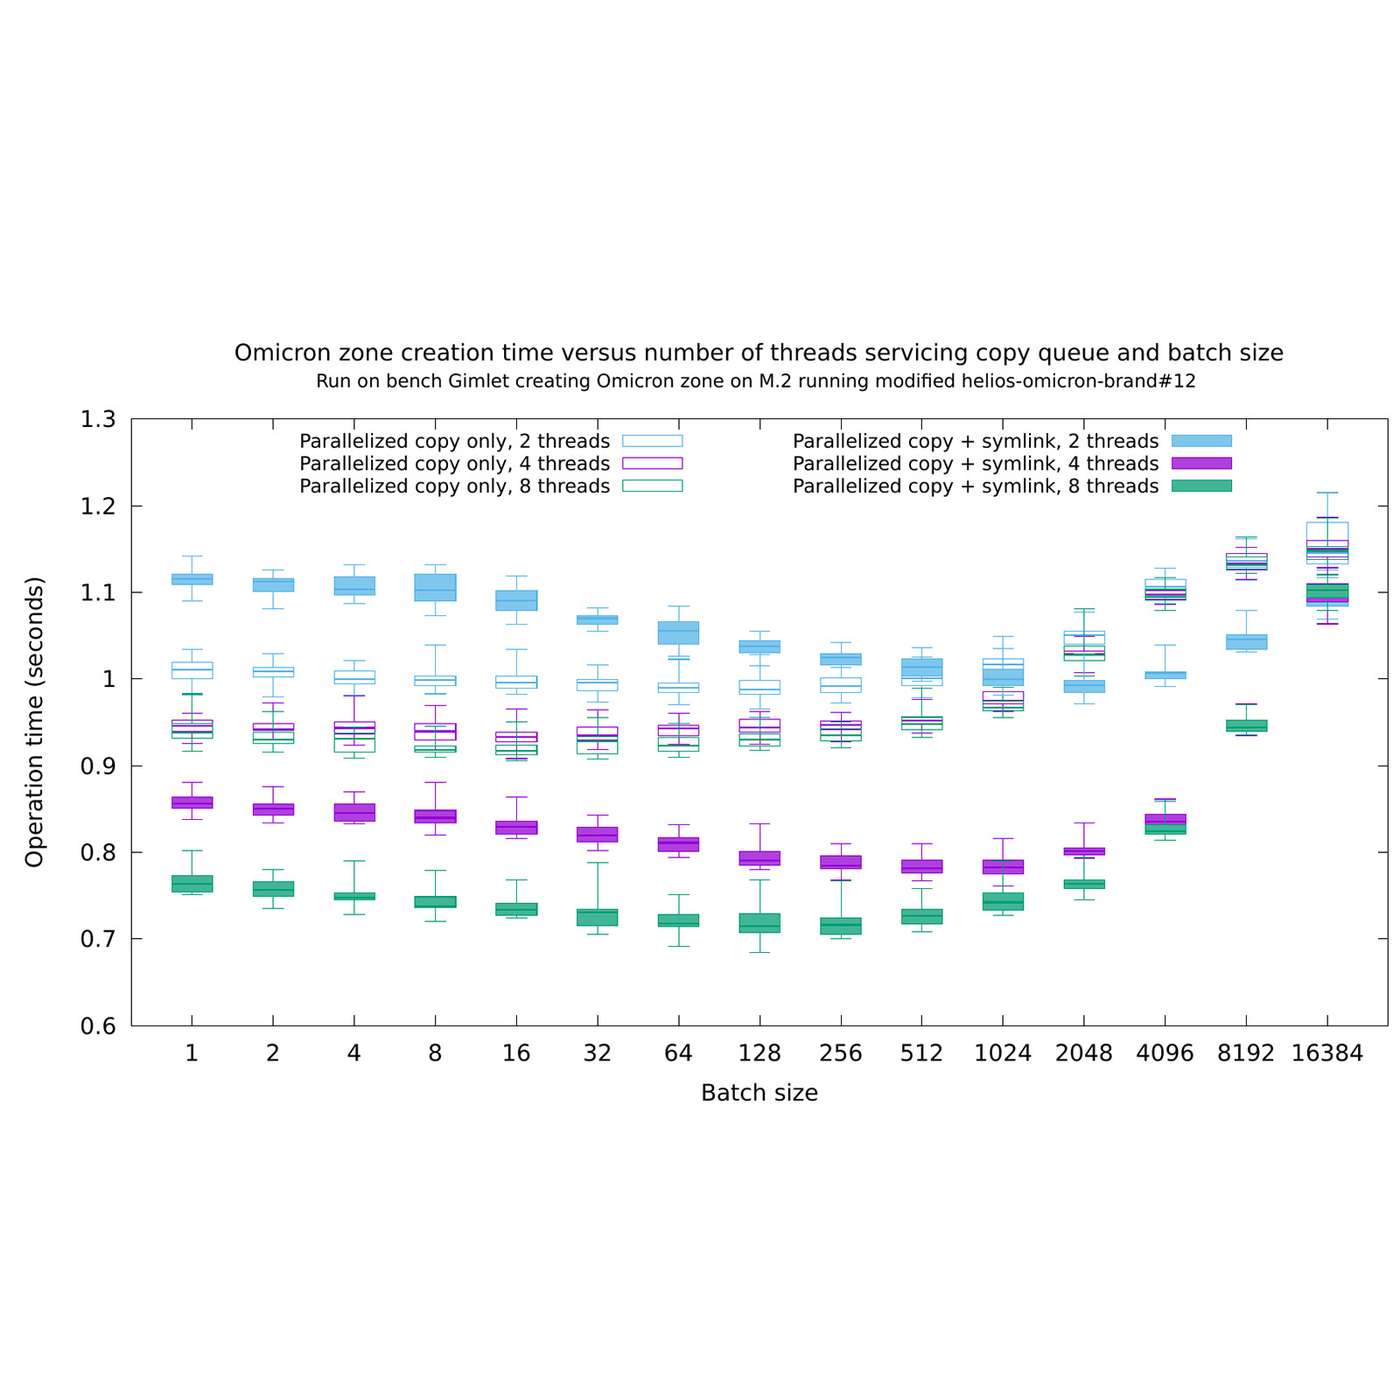
Data visualization is an important--and overlooked!--tool in the software engineer's tool belt. Bryan describes a recent journey with gnuplot while Oxide colleague, Charlie Park, shares his own experience with data visualization and Adam offers a visual analysis of Simpsons episodes. Stay tuned to the end to find out about the Oxide and Friends book club coming up in May.
In addition to Bryan Cantrill (mastodon.social/@bcantrill) and Adam Leventhal (mastodon.social/@ahl), we were joined by Oxide Colleague, Charlie Park.
• () - Intro
• () - OODA
• () - Back to Bryan
• () - Flame Graphs
• () - Statemap
• () - Minard / Tufte
• () - thingskatedid
• () - DTrace aggregations
• () - ParaView
• () - Simpsons IMDb
• () - Survivorship Bias
• () - Kartlytics
• () - Kartlytics sample group
• () - Wrapping up
• () - OxF book club
Some of the topics we hit on, in the order that we hit them:
• Bryan's rad gnuplot (twitter.com/bcantrill/status/1760501008126619967)• GitHub PR with Bryan's visualizations (github.com/oxidecomputer/helios-omicron-brand/…)
• Tufte• Pronunciation of "Tufte" (edwardtufte.com/bboard/q-and-a-fetch-msg?msg_i…) is /ˈtʌfti/ (en.wikipedia.org/wiki/Edward_Tufte)
• Flame Graphs (brendangregg.com/flamegraphs.html)
• github.com/flamegraph-rs/flamegraph
• OODA
• This American Life: A Little Bit of Knowledge (thisamericanlife.org/293/transcript)
• Statemaps (github.com/oxidecomputer/statemap)
• Minard's diagram (edwardtufte.com/tufte/minard)
• twitter.com/thingskatedid/status/1386077306381… plot.awk (gist.github.com/katef/fb4cb6d47decd8052bd0e8d8…)
• Visualizing regular expressions (github.com/katef/libfsm) and BNF grammars (github.com/katef/kgt) with Graphviz
• Example implementations of github.com/dangermike/random_tools/blob/master… and github.com/dangermike/random_tools/blob/master…
• DTrace aggregations (bcantrill.dtrace.org/2013/11/10/agghist-aggzoo…)
• Rust crate github.com/ratatui-org/ratatui
• Programs and libraries for plotting and other data visualizations:• gnuplot.info
• Matplotlib (matplotlib.org)
• ggplot2.tidyverse.org
• ParaView (paraview.org)
• GLVis (glvis.org)
• Simpsons IMDB visualization
• Abraham Wald and the airplane diagram with red bullet holes – here’s the origin story (cameronmoll.com/journal/abraham-wald-red-bulle…)
• Kartlytics (davepacheco.net/blog/2013/kartlytics)
• How Life Works (press.uchicago.edu/ucp/books/book/chicago/H/bo…) by Philip Ball
If we got something wrong or missed something, please file a PR! Our next show will likely be on Monday at 5p Pacific Time on our Discord server; stay tuned to our Mastodon feeds for details, or subscribe to this calendar (calendar.google.com/calendar/ical/c_318925f418…). We'd love to have you join us, as we always love to hear from new speakers!